
If you don’t need advanced graph layout for your diagrams there are lots of free frameworks out there giving good results, Syncfusion being one of them. Many component vendors have something similar:
and many more. The good about components like these is that they work well together with the other components in the same suite and they are ‘free’. They can’t be compared to high-end tools like yFiles or Go.js but if you are looking for basic diagramming features they often are enough.
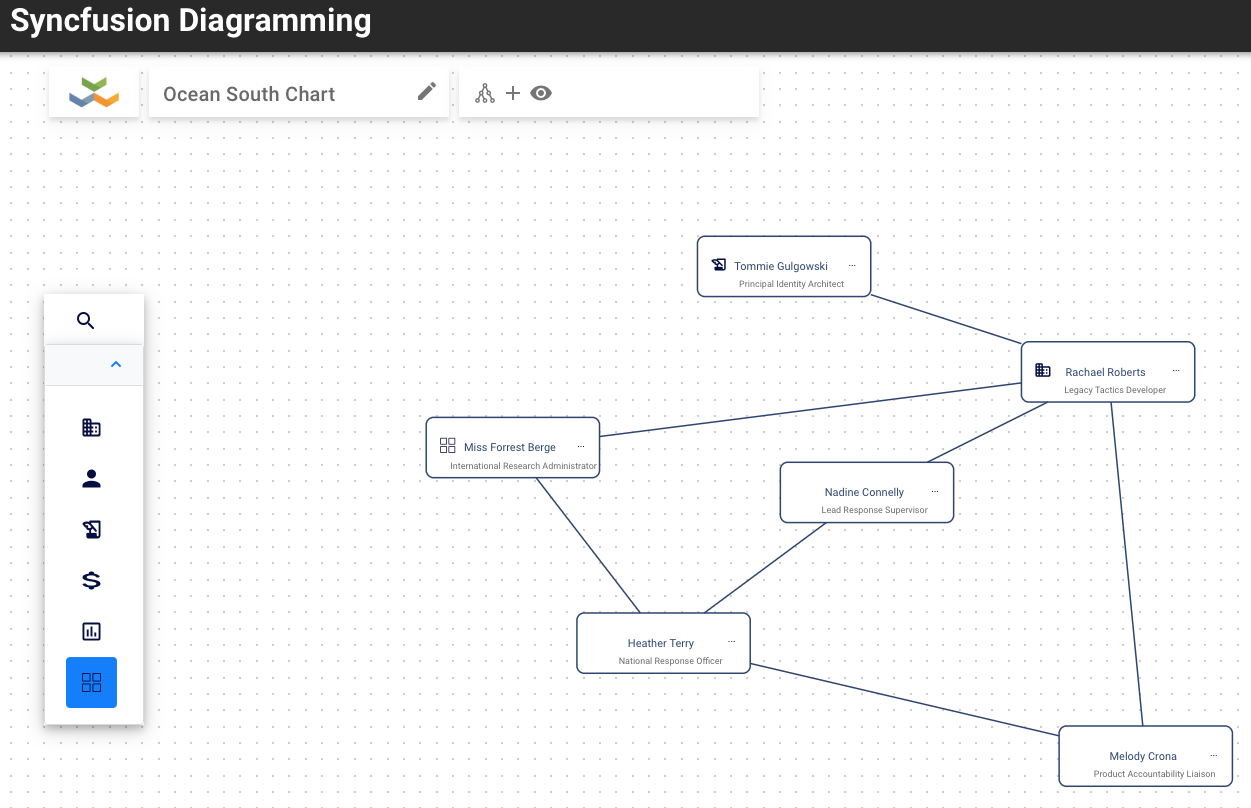
Click here for a live version.
We regularly make proof of concepts for customers on top of such basic frameworks and in this Github repo you can find a typical (unsophisticated) diagramming POC. It’s based on Syncfusion but the setup with other frameworks is very similar. Also, you can use Angular or React instead of Vue but in the end it all amounts to the same conceptual and development process.
To run it simply clone the repo
git clone https://github.com/Orbifold/syncfusion-diagramming.gitthen install and run like any other NodeJS app:
npm i
npm start
In practice many of such POC turn later on into grand applications with more advanced graph visualization (Ogma, yFiles and alike) and backend systems but you can go nowadays quite far without spending much money. Give it a shot and let us know.