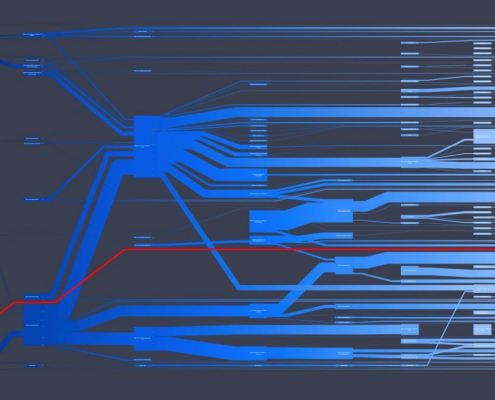
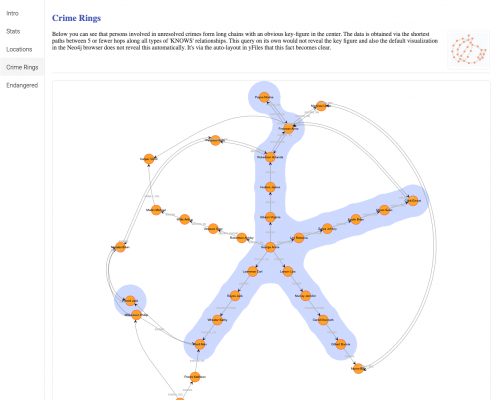
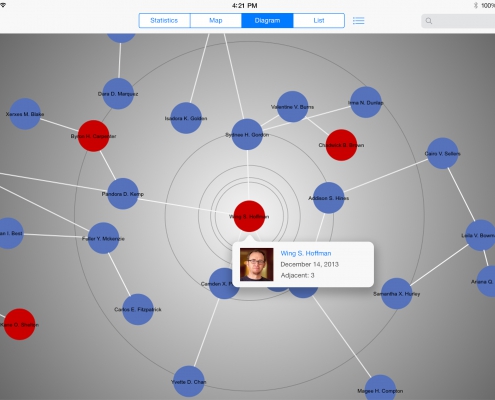
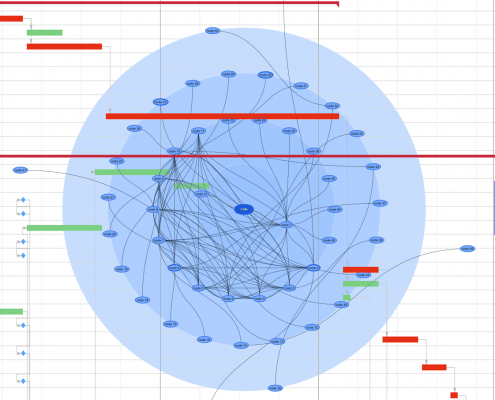
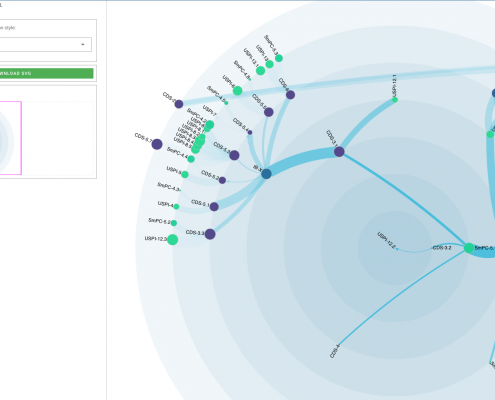
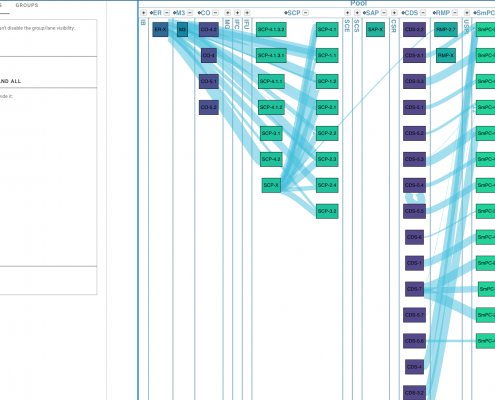
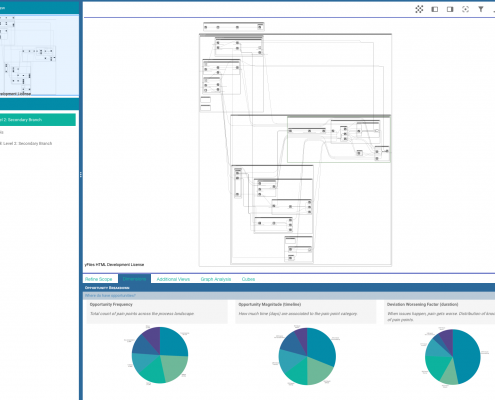
We develop graph visualizations and compelling enterprise apps on top of this industry-leading diagramming framework.
What we do
yFiles has tremendous potential and if you are looking for the very best graph layout algorithms there is nothing better on the planet. With this extensive framework comes a steep learning curve and it can be a daunting task for developers to get productive in a short timeframe. We help companies getting the most out of yFiles and have partnered with yWorks in the past 10+ years to deliver high-quality consulting and guidance.
We have a broad experience across different technologies, industries and businesses. We understand the software aspects, the business context and have a keen eye for user experience.
Typical consulting projects & applications
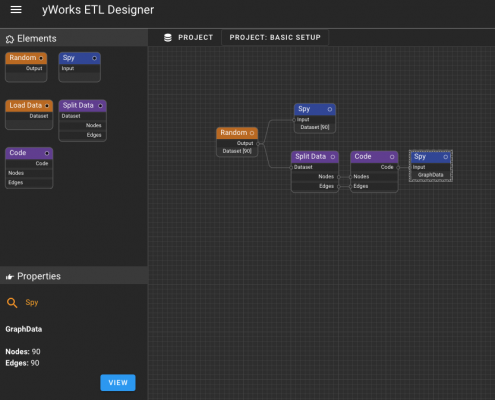
- Enterprise app development with a focus on graphs and highly interactive UX We (co-)develop web apps of any size and complexity using state-of-the-art frameworks and technology. This includes custom middleware and backend architecture with the appropriate technology and with all the rigor and adjacent systems: devops, CI/CD, testing, security, privacy and more.
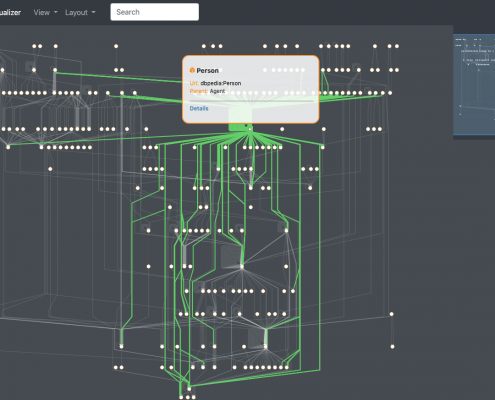
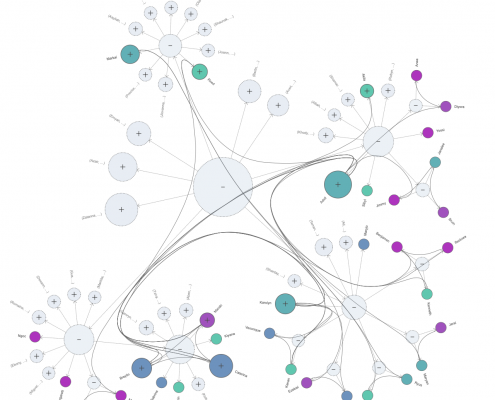
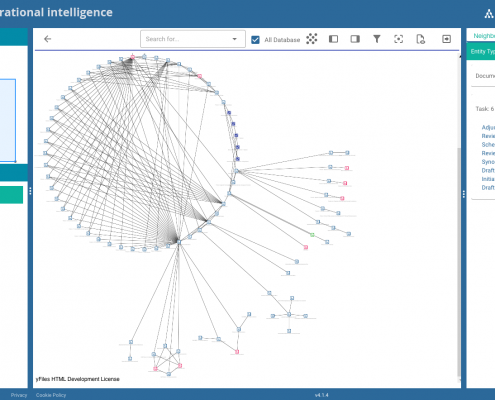
- Ontology visualizers and schema editors Many graph databases don’t have a rich UI and many don’t enforce a schema or ontology. While it seems great at first to develop without a schema you quickly discover that you end up with a haystack of data. Even more, inference and reasoning is only possible on the basis of an ontology. We develop custom apps for your triple store or property graph to visualize, edit and manage schema’s.
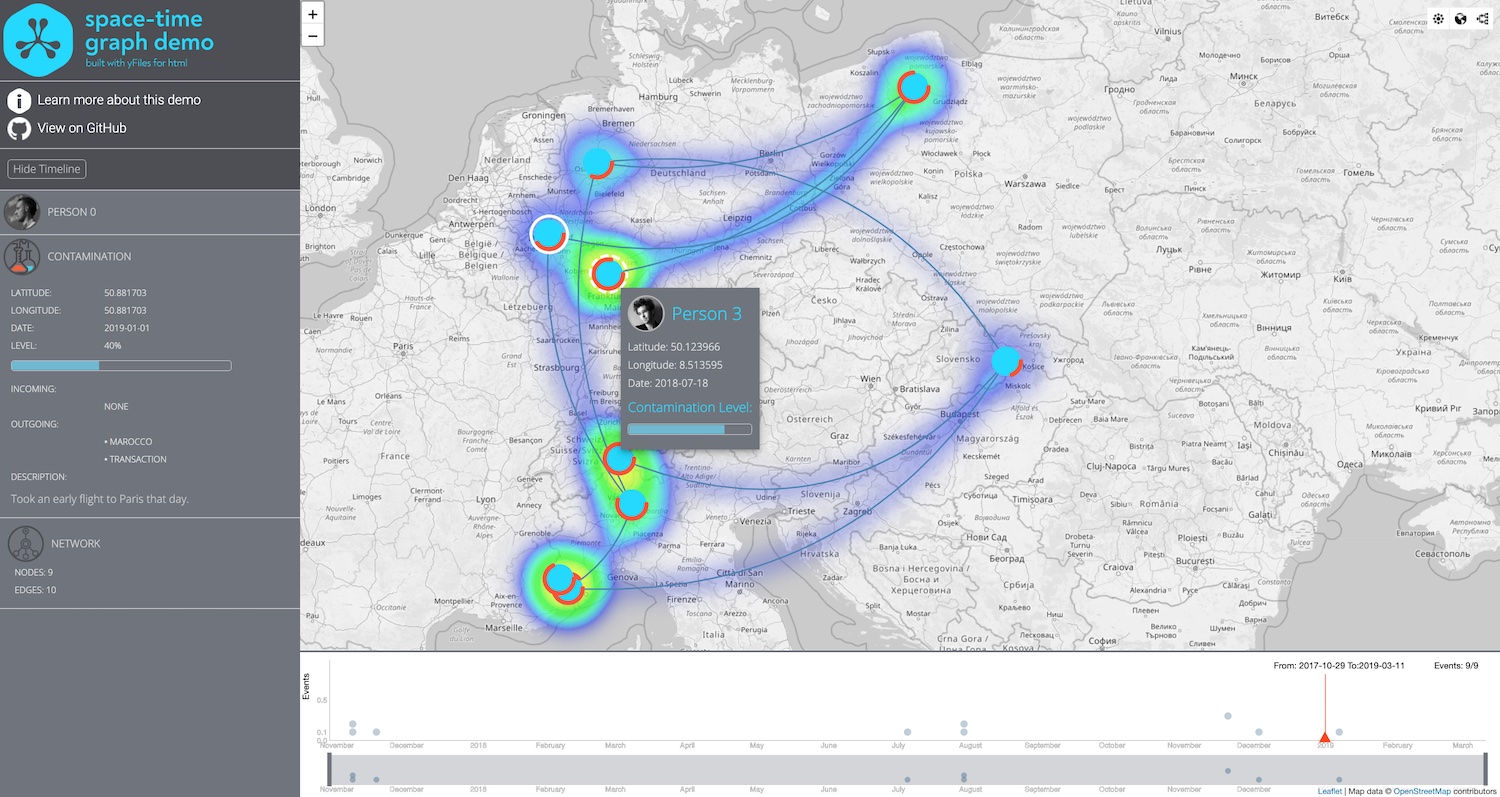
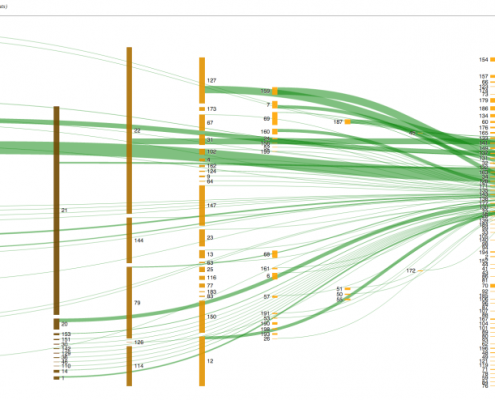
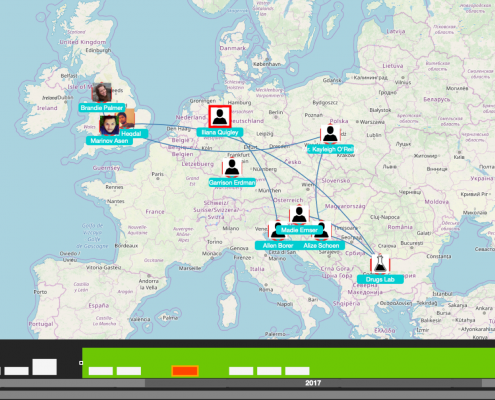
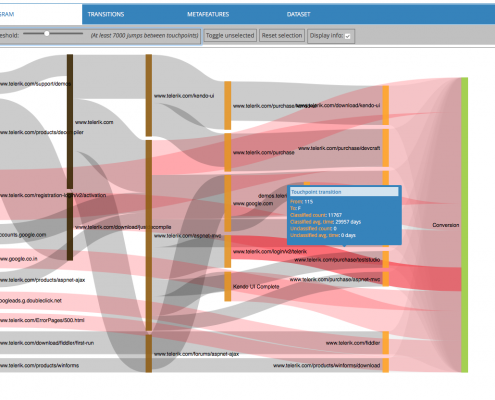
- Multi-dimensional data visualizations Graphs visualize relationships but often additional measures and other dimensions play a key-role in decision making as well. If you wish to pivot your data in time and overlay it on top of geo-spatial data you need a firm technical understanding of the various layers and frameworks. We help enterprises and organizations to articulate their data in the relevant dimensions and measures.
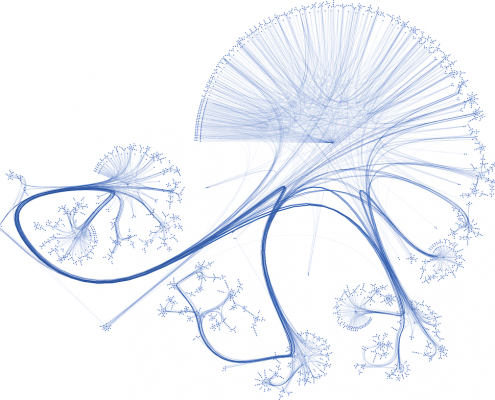
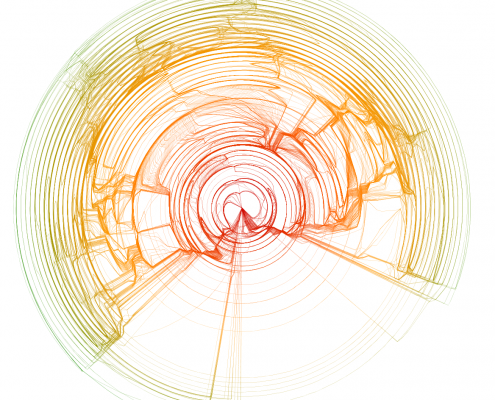
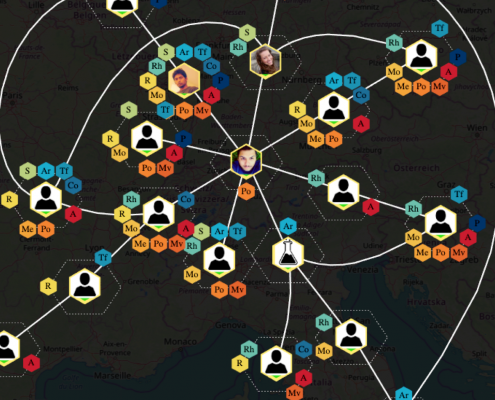
- Innovative and compelling UI Sometimes you need a bit of woaw in your UI to impress customers, stakeholders and investors. We know how to inject art, color and delight in graph visualizations without compromising information.
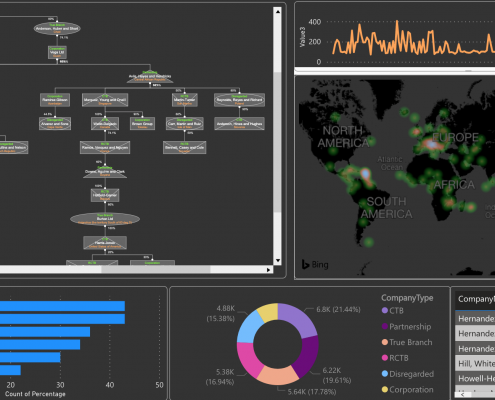
- Integrating yFiles in BI tools Business intelligence tools like Tableau and Microsoft Power BI don’t support advanced network visualization. At most they explain you how d3.js can be used, resulting in the typical dissatisfying force-directed layout. We have yFiles toolkits for these BI apps and can help you with the integration of graph-like data. Filtering, slicing and integration of traditional widgets (pie charts, maps, bar charts…) with graph data enables amazing scenarios and dashboards.
Why yFiles?
The unique selling points of yFiles are:
- The very best diagramming and graph visualization framework on the planet. The most complete package (in every sense) you’ll find anywhere.
- Extensive graph layout library. More than most enterprise apps need.
- Extensive documentation and very pure API.
- Very complete and elaborate documentation.
- Made for heavy lifting and enterprise needs.
Of course, quality has a price. Mastering the API comes with a steep learning curve and we can help you get the most of yFiles. We have developed tons of enterprise applications with yFiles and can guide you through the many options this amazing framework offers.

