What is Ogma?
The Linkurious intelligence platform has a powerful graph visualization framework called Ogma which can be used independently of the platform. It shines in its ease to produce powerful data-driven visualizations with very little code. Much like the enterprise platform, there is a clear focus on making it easy to discover business insights and it does this with delightful simplicity without sacrificing flexibility or scale. It allows one to render and layout many thousands of nodes while at the same time enabling key-features like automatic grouping, clustering, finding cycles, anomalies and much more.
We partner with Linkurious and develop compelling business-driven enterprise applications using Ogma.
Geo-spatial enabled
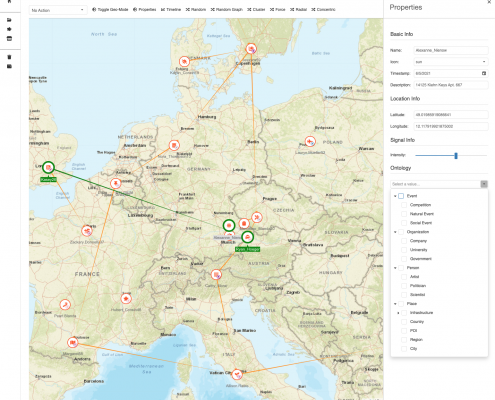
Although other graph visualization frameworks demonstrate geo-spatial integrations, Ogma does it out of the box with just a few line of code.
- easily overlay graphs on maps, it takes no time or custom classes to enable it
- ESRI support allowing to integrate many different kinds of geographic data sources
- automatic Leaflet.js integration, so easy to get things done
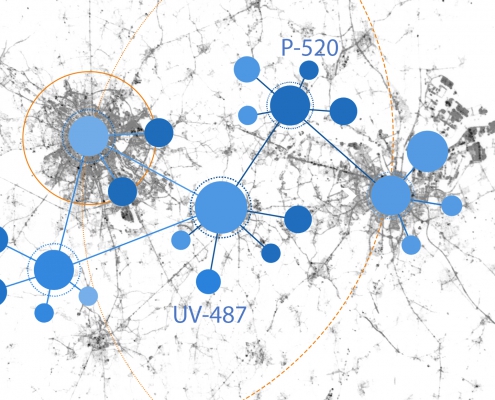
- automatic geo-clustering: you see more as you zoom into the geographic region. This allows an easier visual analysis of relationships.
- integration with MapBox: elevated terrains, customizable skies and atmospheric lighting all within reach.
- toggle between geo-mode and standard mode: it automatically filters out nodes with lat-long coordinates. Easy.
- support for GeoJSON.
Simple yet powerful
Ogma has a straightforward API geared towards productivity yet manages to produce stunning results:
- no complex setup, license files, dependencies or learning curve
- works in all major frameworks; Angular, Vue, React, TypeScript, plain JS and more
- powerful layout algorithms: automatic organization of tens of thousands of nodes and edges.
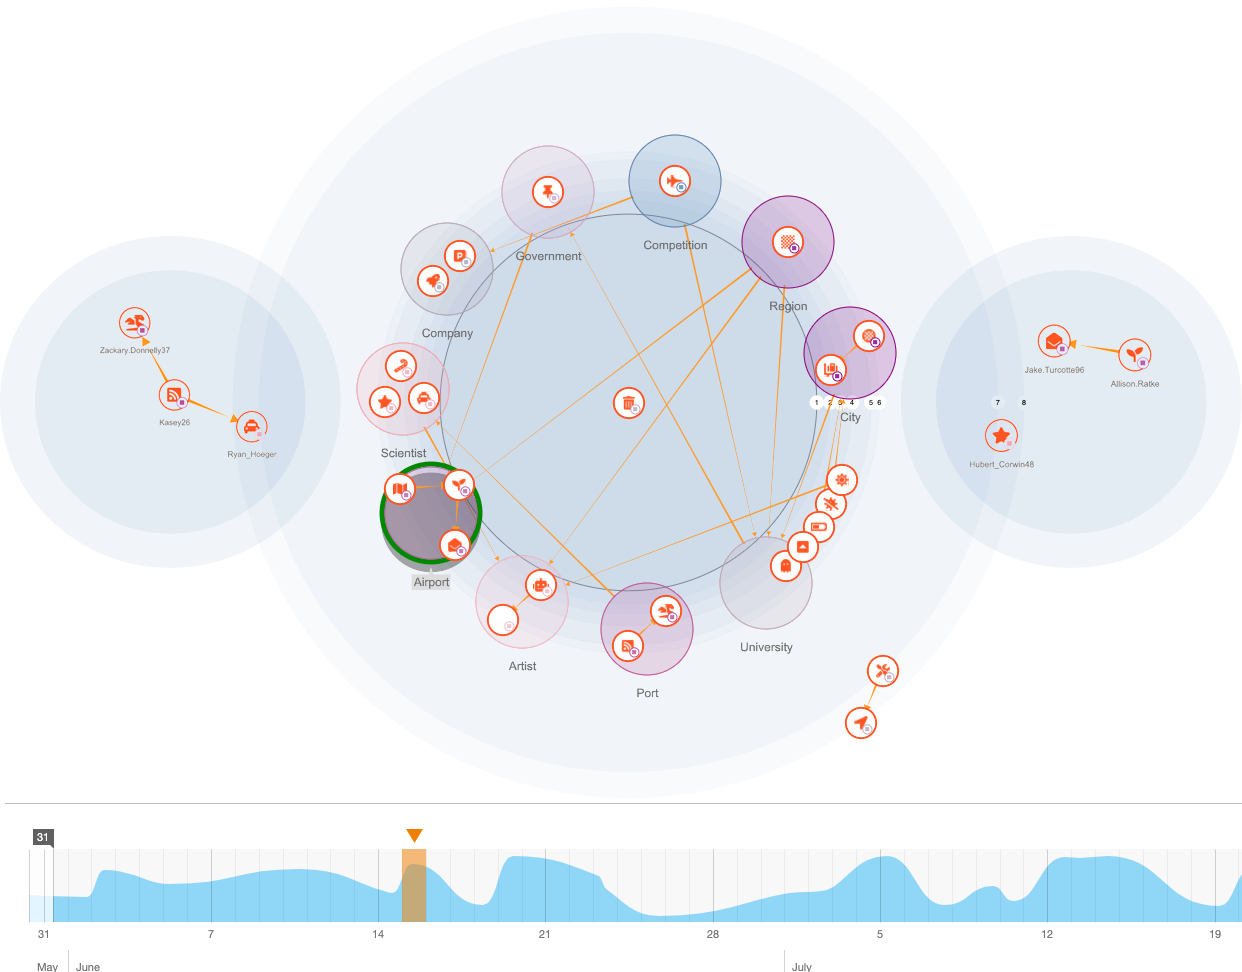
- automatic clustering based on business entities and properties. No need for lots of code, get things done in no time.
- data-driven styling out of the box: simple rules define how style elements depend on data properties
- business-oriented and data discovery with ease: the API offers all you need to create the business visualizations you need (anomaly detection, clusters, rings…).
Frameworks like yFiles can articulate anything you can imagine but come with a steep learning curve and a vast API you need to master. Ogma on the other hand focuses on data visualization and business insights. It will not articulate database diagrams, business process diagrams or any diagram where nodes have complex visual properties or interactions. Within these limitations, it’s an extremely pleasant framework to work with and oozing powerful productivity.
Layout power
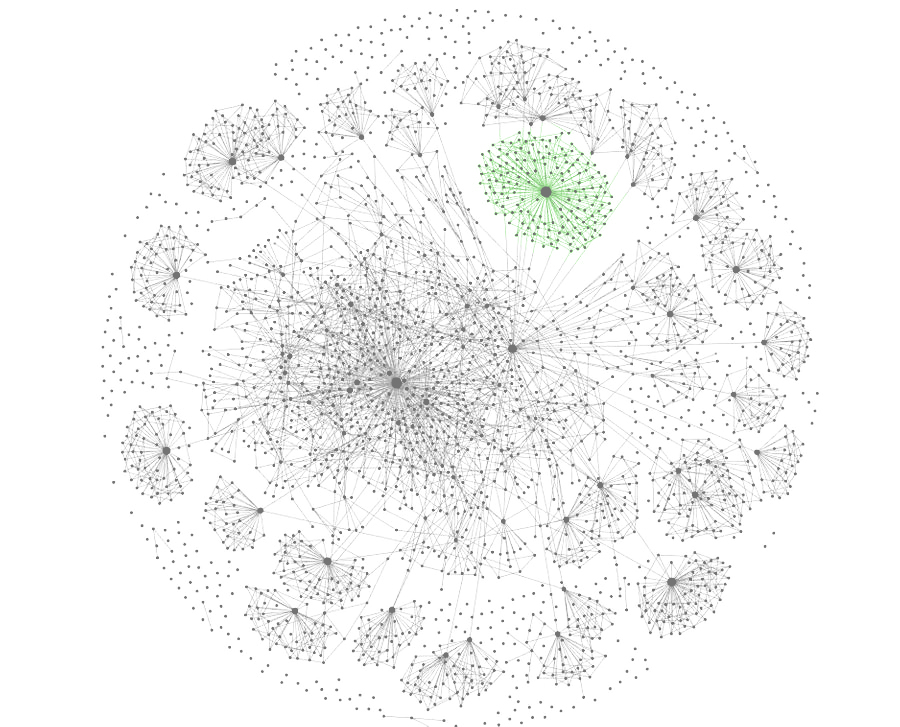
Ogma does not come with tons of layout algorithms or parametrizations but the handful of layout algorithms will allow you to visualize tens of thousands of nodes while remaining interactive and fluid. Like everything else in Ogma, this comes free of charge. No need to rewrite anything in function of WebGL or change of templates, it just happens.
The layout algorithms work harmoniously with grouping, clustering and styling mechanisms. Like everything else, things are straightforward and effective towards data discovery and business visualizations.
Layout of tens of thousands of nodes while remaining interactive and fluid.
If you have sophisticated graph layout needs, consider yFiles instead. It offers a deep tuning of algorithms. On the other hand, if your app needs a bit of editing and a bit of layout consider looking at Go.JS.


