Graph Visualization & Application Development
An intelligent solution paired with vast amounts of data demands a polished, user-friendly application that not only highlights the unique features of your product but also delivers a seamless and engaging experience. Achieving this requires more than just assembling the right components; it calls for a comprehensive understanding of the entire ecosystem. The challenge lies in creating something that appears simple on the surface yet is powered by cutting-edge technology underneath—an application that strikes the perfect balance between elegance and capability.
Our approach to software development and business strategy is holistic, integrating a profound mastery of scientific and technical expertise with a creative, artistic sensibility. We believe that a truly successful product is one that fuses functionality with aesthetic appeal, providing both performance and a user experience that resonates. By combining data science, artificial intelligence, and innovative design, we craft solutions that not only solve complex problems but also communicate the value of your product in a way that feels intuitive and engaging. Our goal is to transform complexity into simplicity, delivering applications that both stand out and drive business success.
Intelligent Solutions
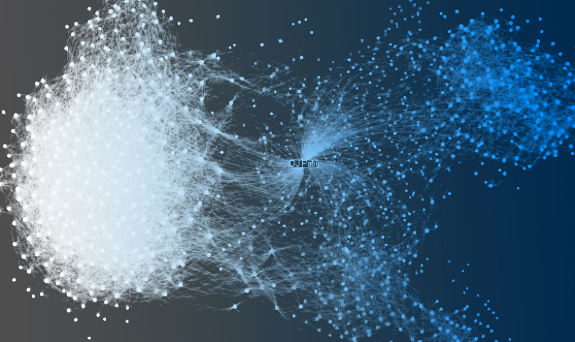
We help companies combining graph learning, graph stores and smart visualization in function of fraud prevention, anti-terrorism, forensic analysis, marketing optimization, anomaly detection and more.
Business solutions combining relational data and networks are everywhere and the usage of graphs as a way to augment artificial intelligence with knowledge is becoming ubiquitous. We have integrated over the years natural language (NLP) techniques with semantic stores, Network inference with image analysis, sound segmentation for legal purposes and much more.
We help companies develop semantic networks, ontologies, inference engines, graph learning systems and heterogeneous solutions. Out-of-the-box thinking is our trademark and we are unafraid of venturing into original, innovative solutions. In function of intellectual property development, investor profiling or because you have a vision.
Application Development
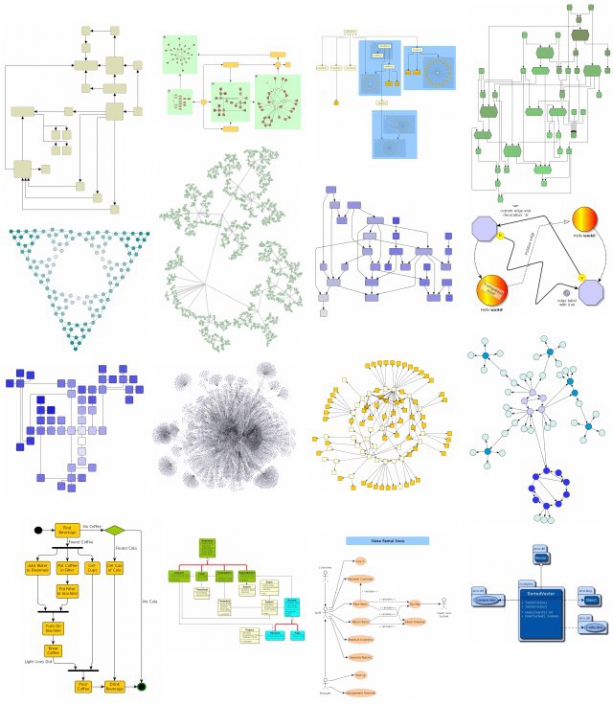
Developing applications and integrations with graph-like data and making use of the various framework can be a challenge sometimes. It ain’t the usual dev job. In fact, selecting the right visualization framework can be a daunting task on its own. Going for open source solutions like Cytoscape, draw.io…but compromising on features and layout capacity? Paying for high-end solutions like yFiles, Go.js, JointJS…?
We have decades of experience and can help. Whether your favorite web flavor is Angular, React or Vue, we have done it before and also understand the ins and outs of graph integrations with backend systems (both relational and NoSQL).
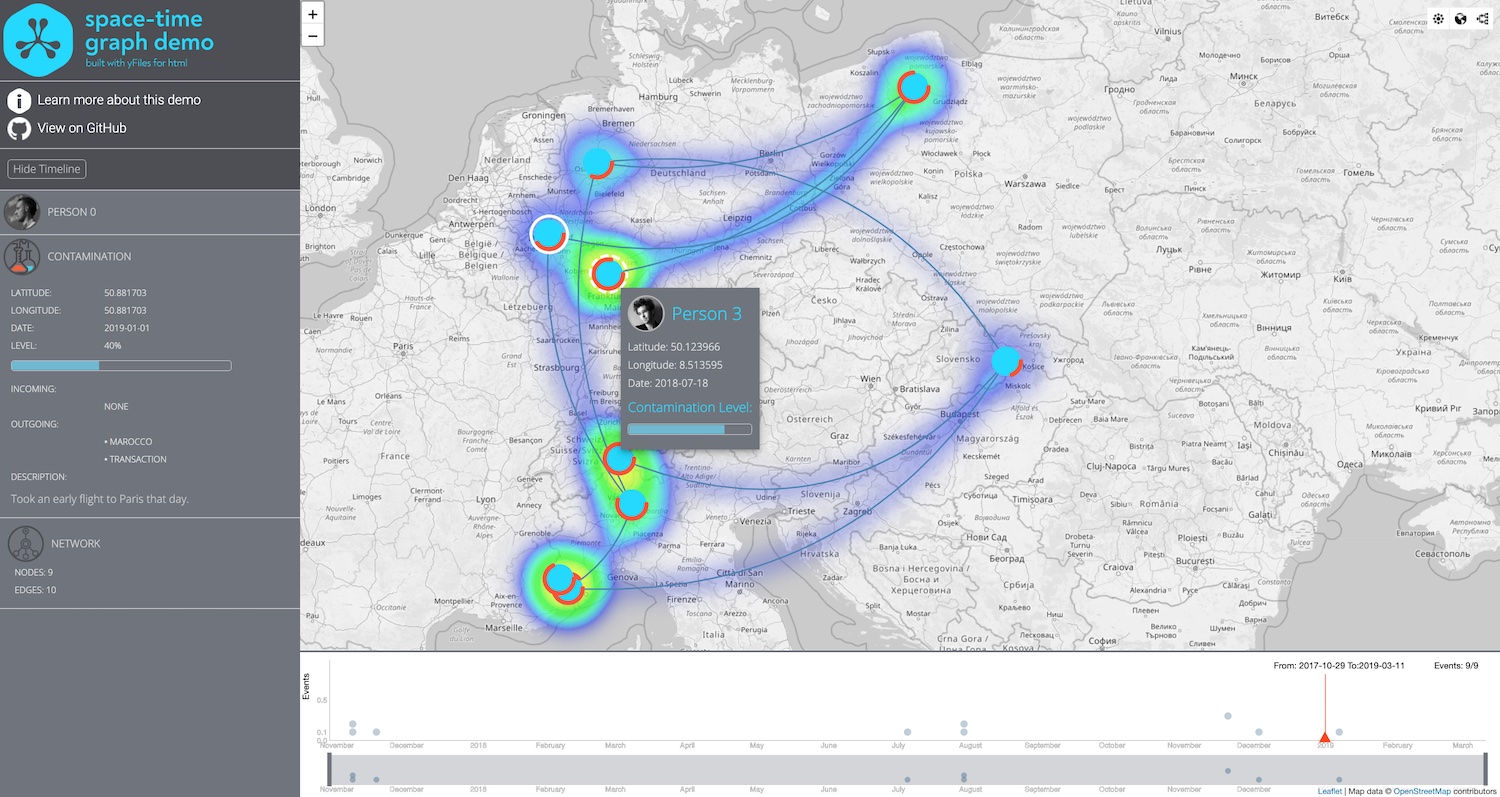
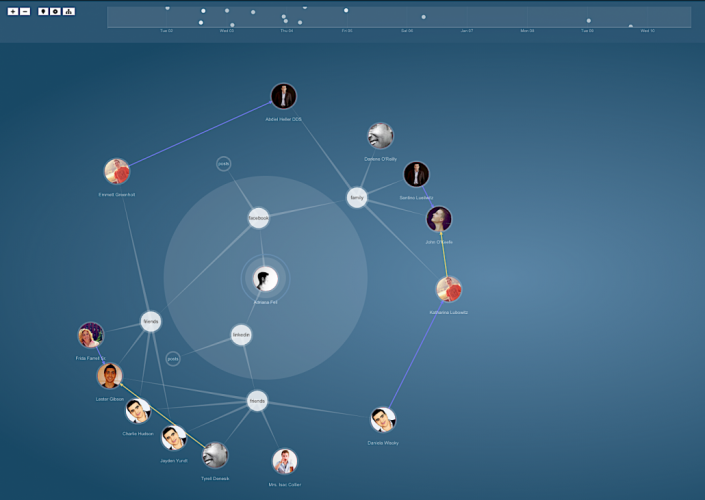
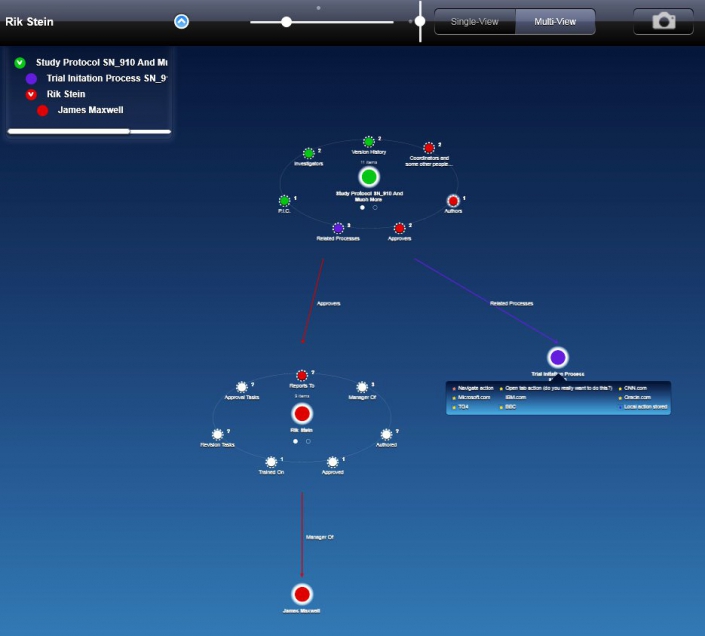
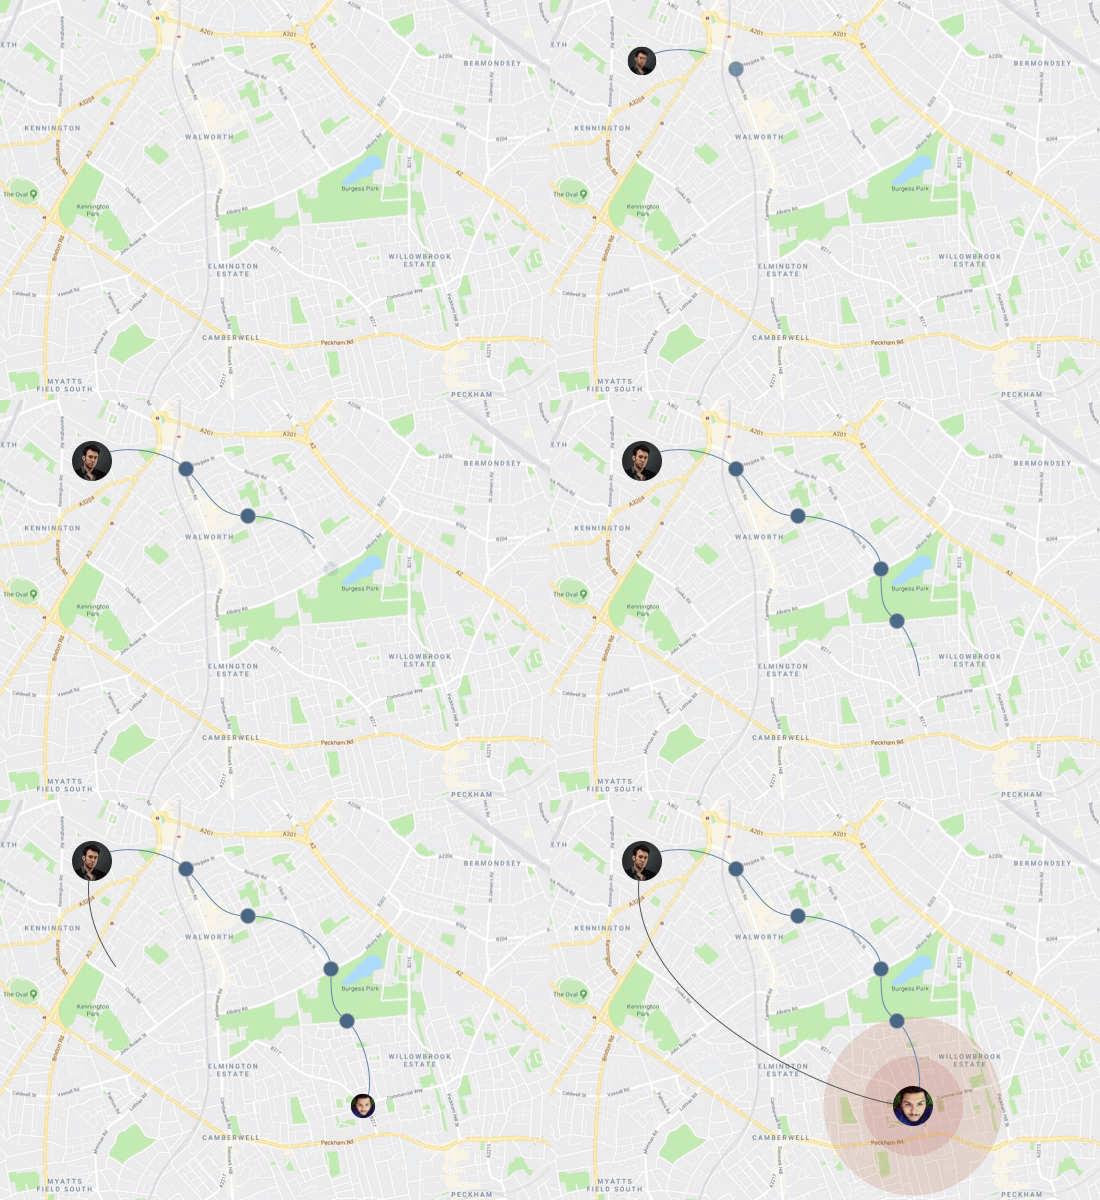
In addition, a good interface tells a story. What’s your business, what’s the aim of your app, what do you wish to convey with the UI flow…? User eXperience development with graphs is also an art on its own. How can one combine geospatial information with temporal data, how should filtering occur, how to combine so many dimensions into a coherent story?
Our Services

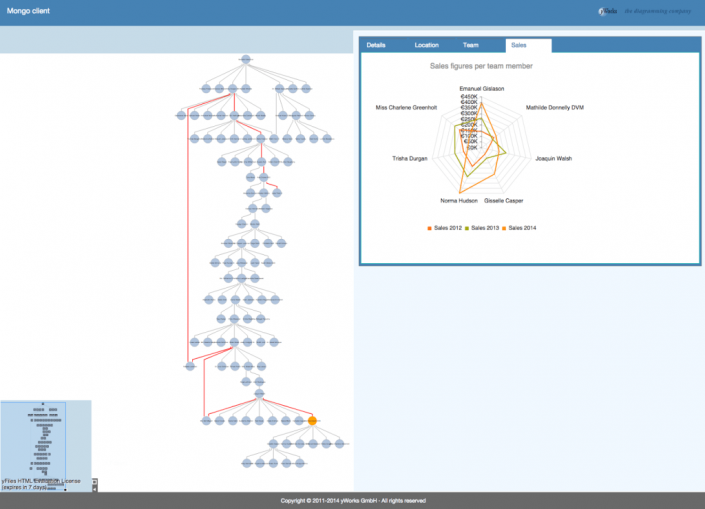
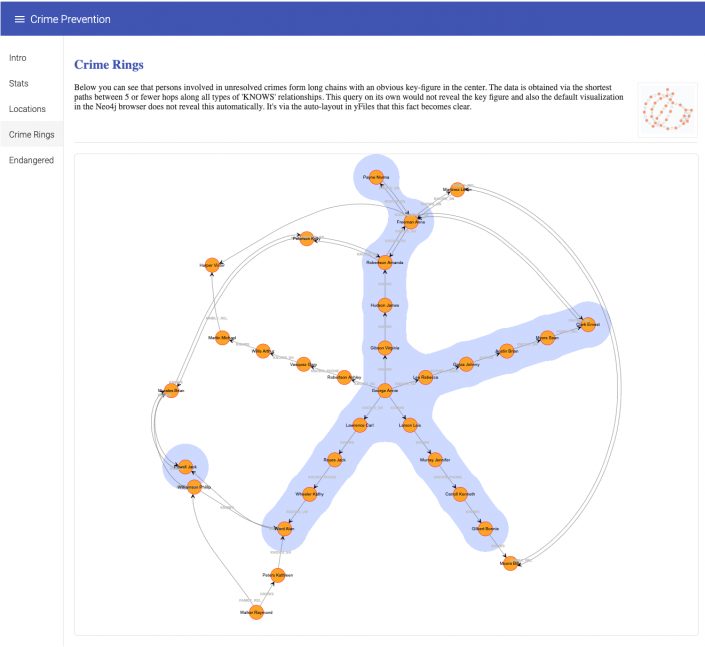
We have worked with and for yWorks in the past 20 years delivering custom solutions using their yFiles diagramming API. We know the ins and outs of the framework and helped businesses get the most out of this exquisite but, at times, also daunting framework. yFiles can articulate pretty much every and any graph visualization need but customers might find the learning curve steep and this is where we come in. We can guide you through the process of turning your ideas into concrete apps and develop stunning graph visualizations.

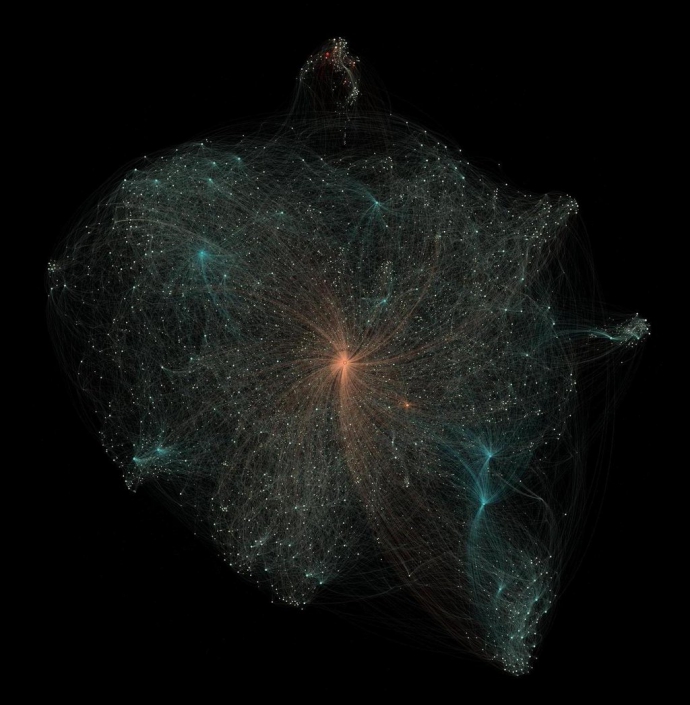
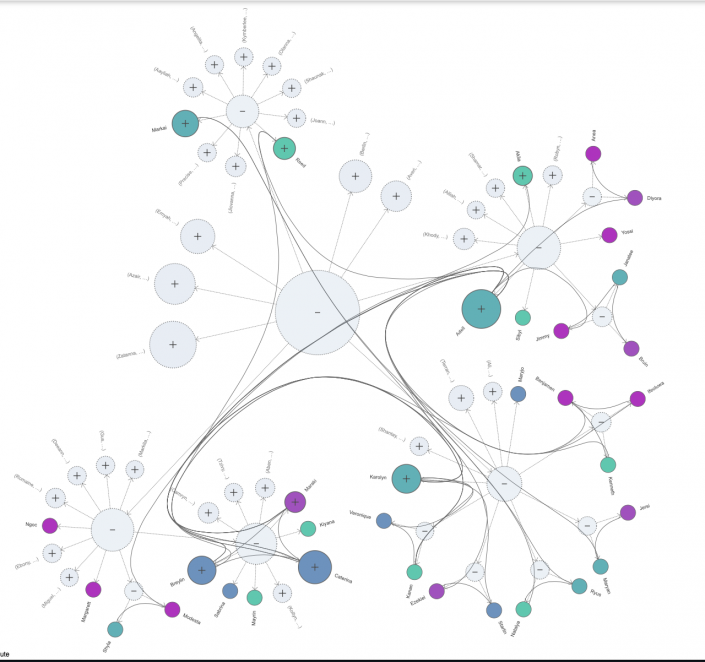
The Linkurious intelligence platform has a powerful graph visualization framework called Ogma which can be used independently of the platform. It shines in its ease to produce powerful data-driven visualizations with very little code. Much like the enterprise platform, there is a clear focus on making it easy to discover business insights and it does this with delightful simplicity without sacrificing flexibility or scale. It allows one to render and layout many thousands of nodes while at the same time enabling key-features like automatic grouping, clustering, finding cycles, anomalies and much more.
We partner with Linkurious and develop compelling business-driven enterprise applications using Ogma.

The Go.js graph visualization framework is an affordable solution with an easy to use API. From simple flowcharts and org charts to highly-specific industrial diagrams, SCADA and BPMN diagrams, medical diagrams such as genograms and outbreak modeling diagrams, and more. GoJS makes constructing graphs of complex nodes, links, and groups easy with customizable templates and layouts. If graph layout is not your main concern then this is for you and we have tons of experience in developing with it.
Awesome Visualizations
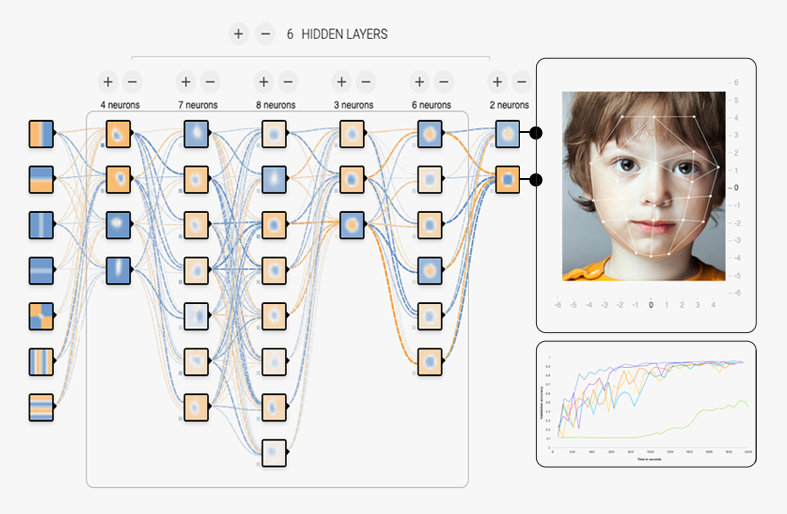
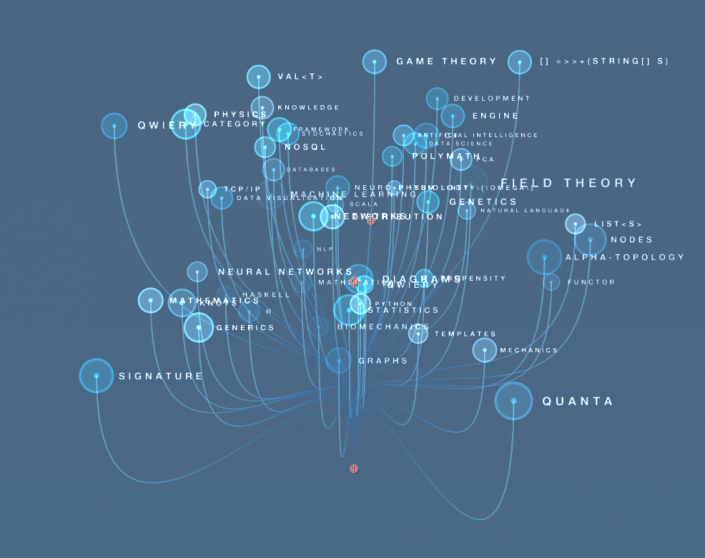
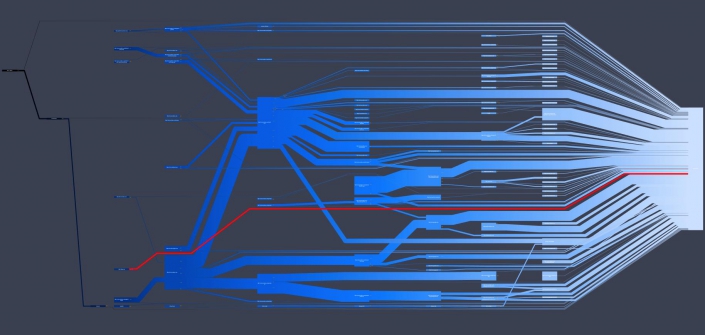
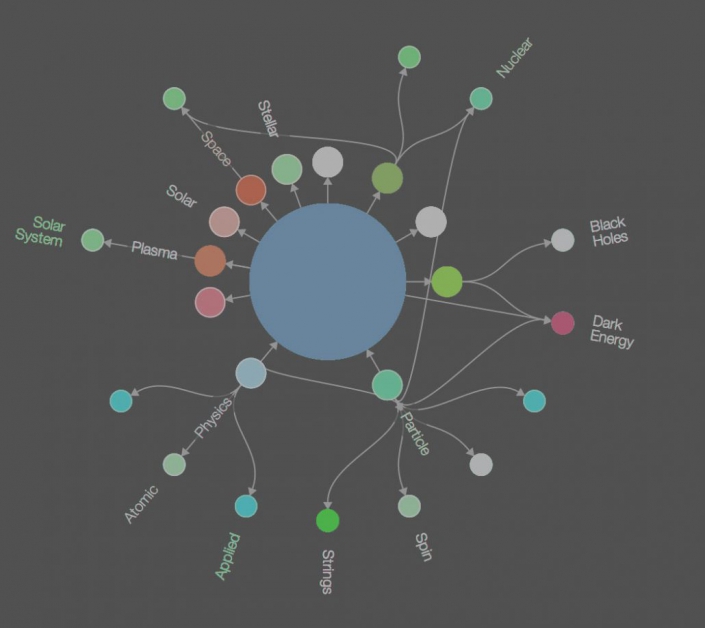
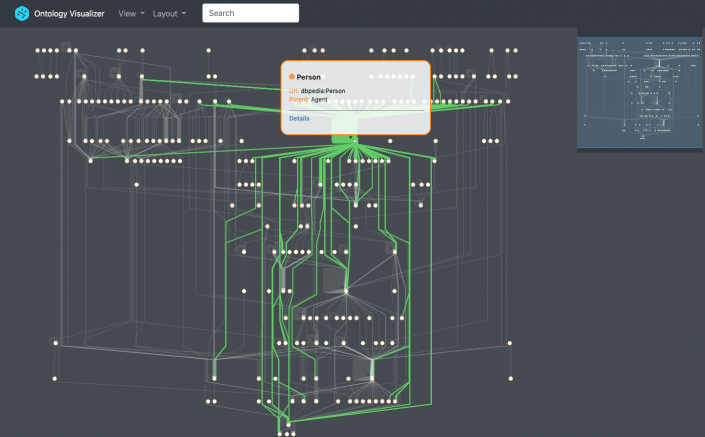
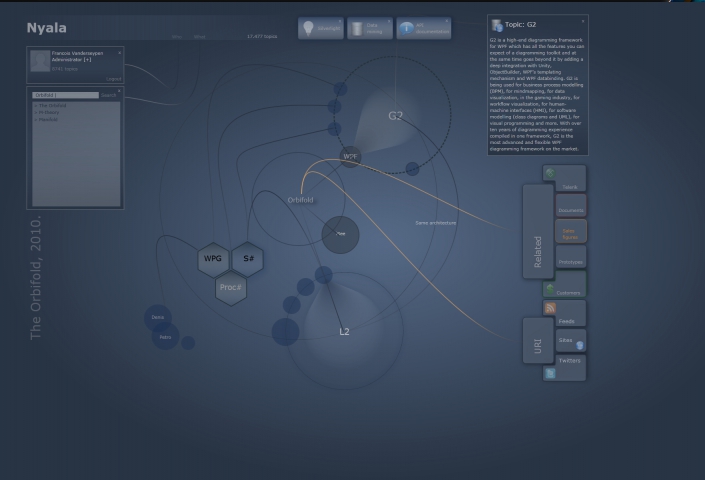
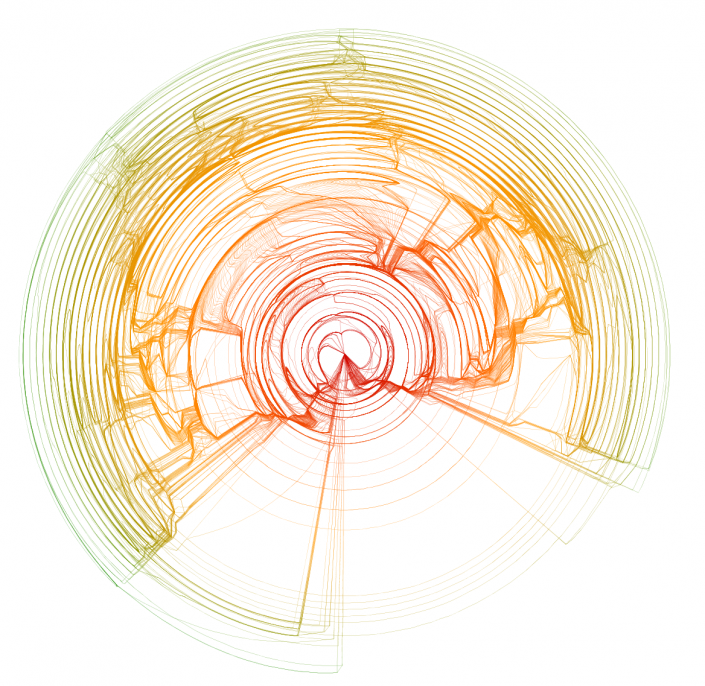
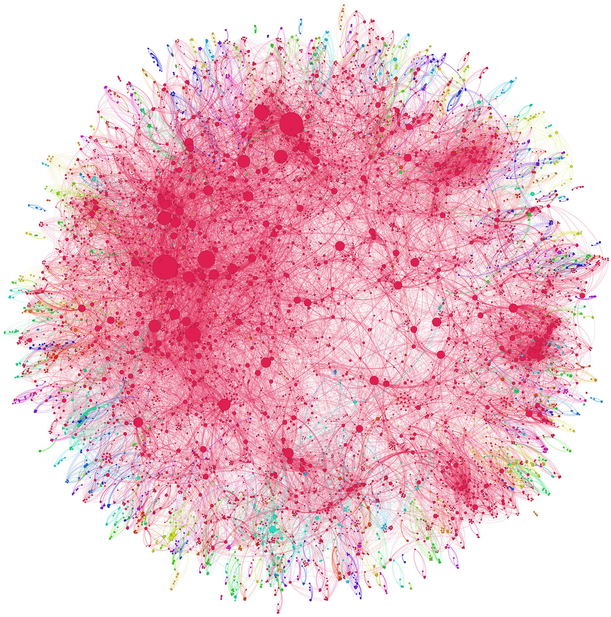
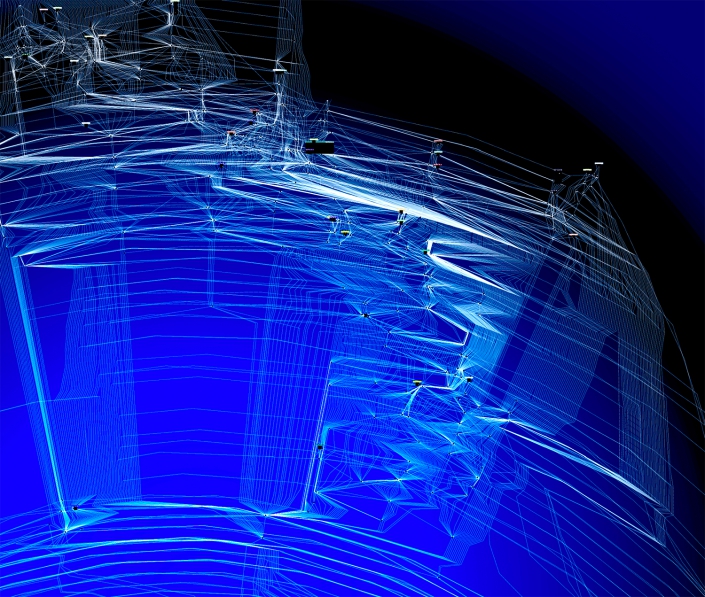
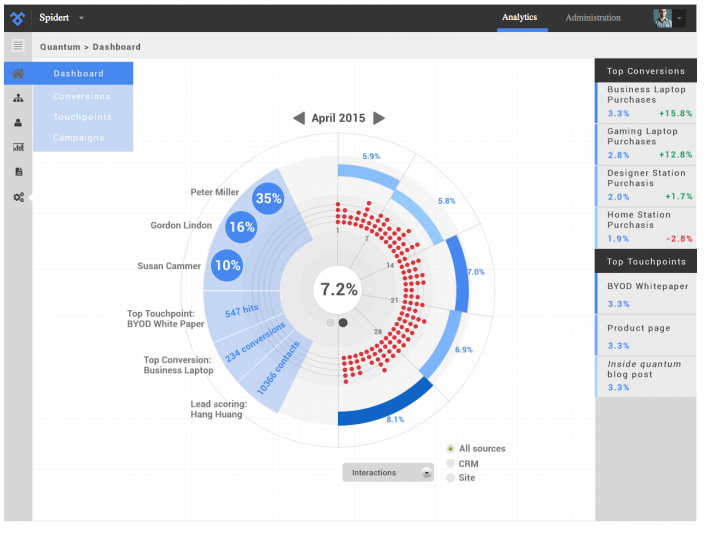
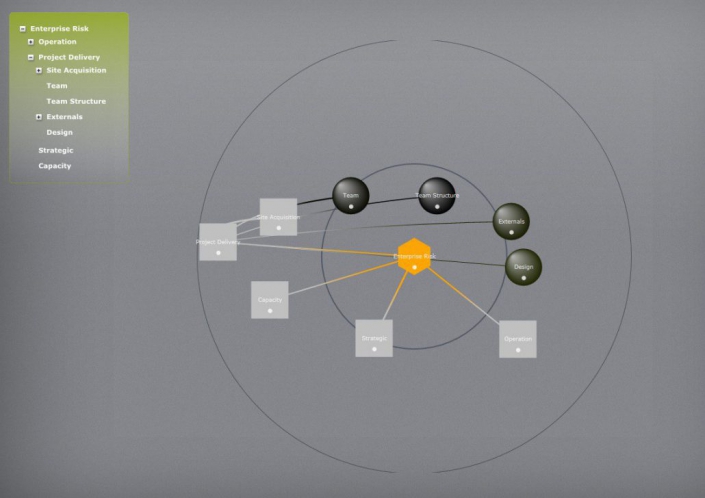
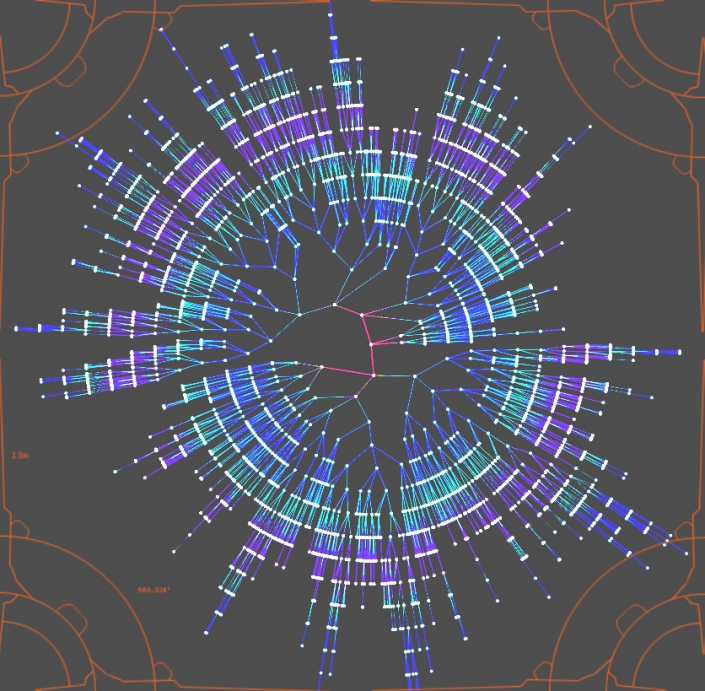
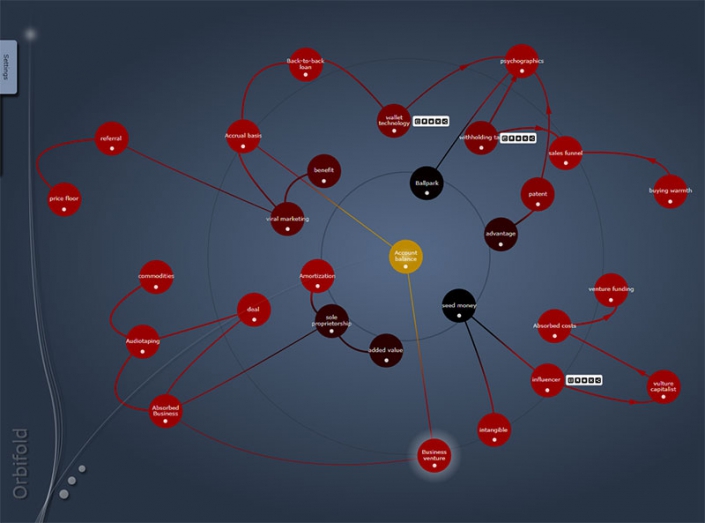
There is more in the world than pie-charts and sliders. If you want to stand out with your product you need to step outside the usual toolset. Developing awesome UX demands a combination of different mindsets: business context, technical understanding, artistic creativity and communication. Over the years we have developed countless extraordinary visualizations and innovative interfaces.
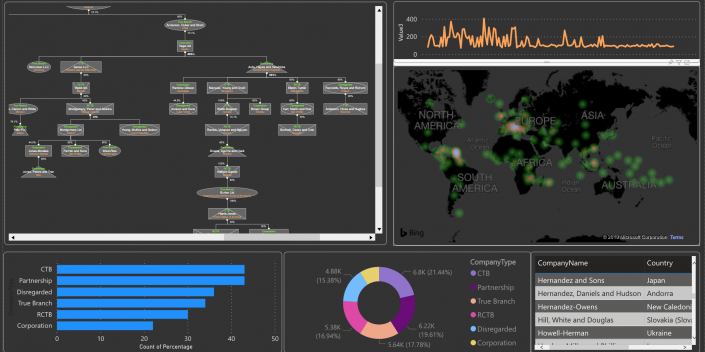
Using anything and everything to make it happen, we know how to create unique visuals and components which rock your apps and concepts. Mockups, motion graphics and prototypes based on Sketch, Axure, Adobe After Effects, Photoshop, Adobe XD, Cinema4D. Fully functional web components using d3, raw Canvas code, Angular, Electron or Kendo. Dashboarding with Tableau, Power BI or Dash. In Python, in JavaScript, WPF or Swift.

